
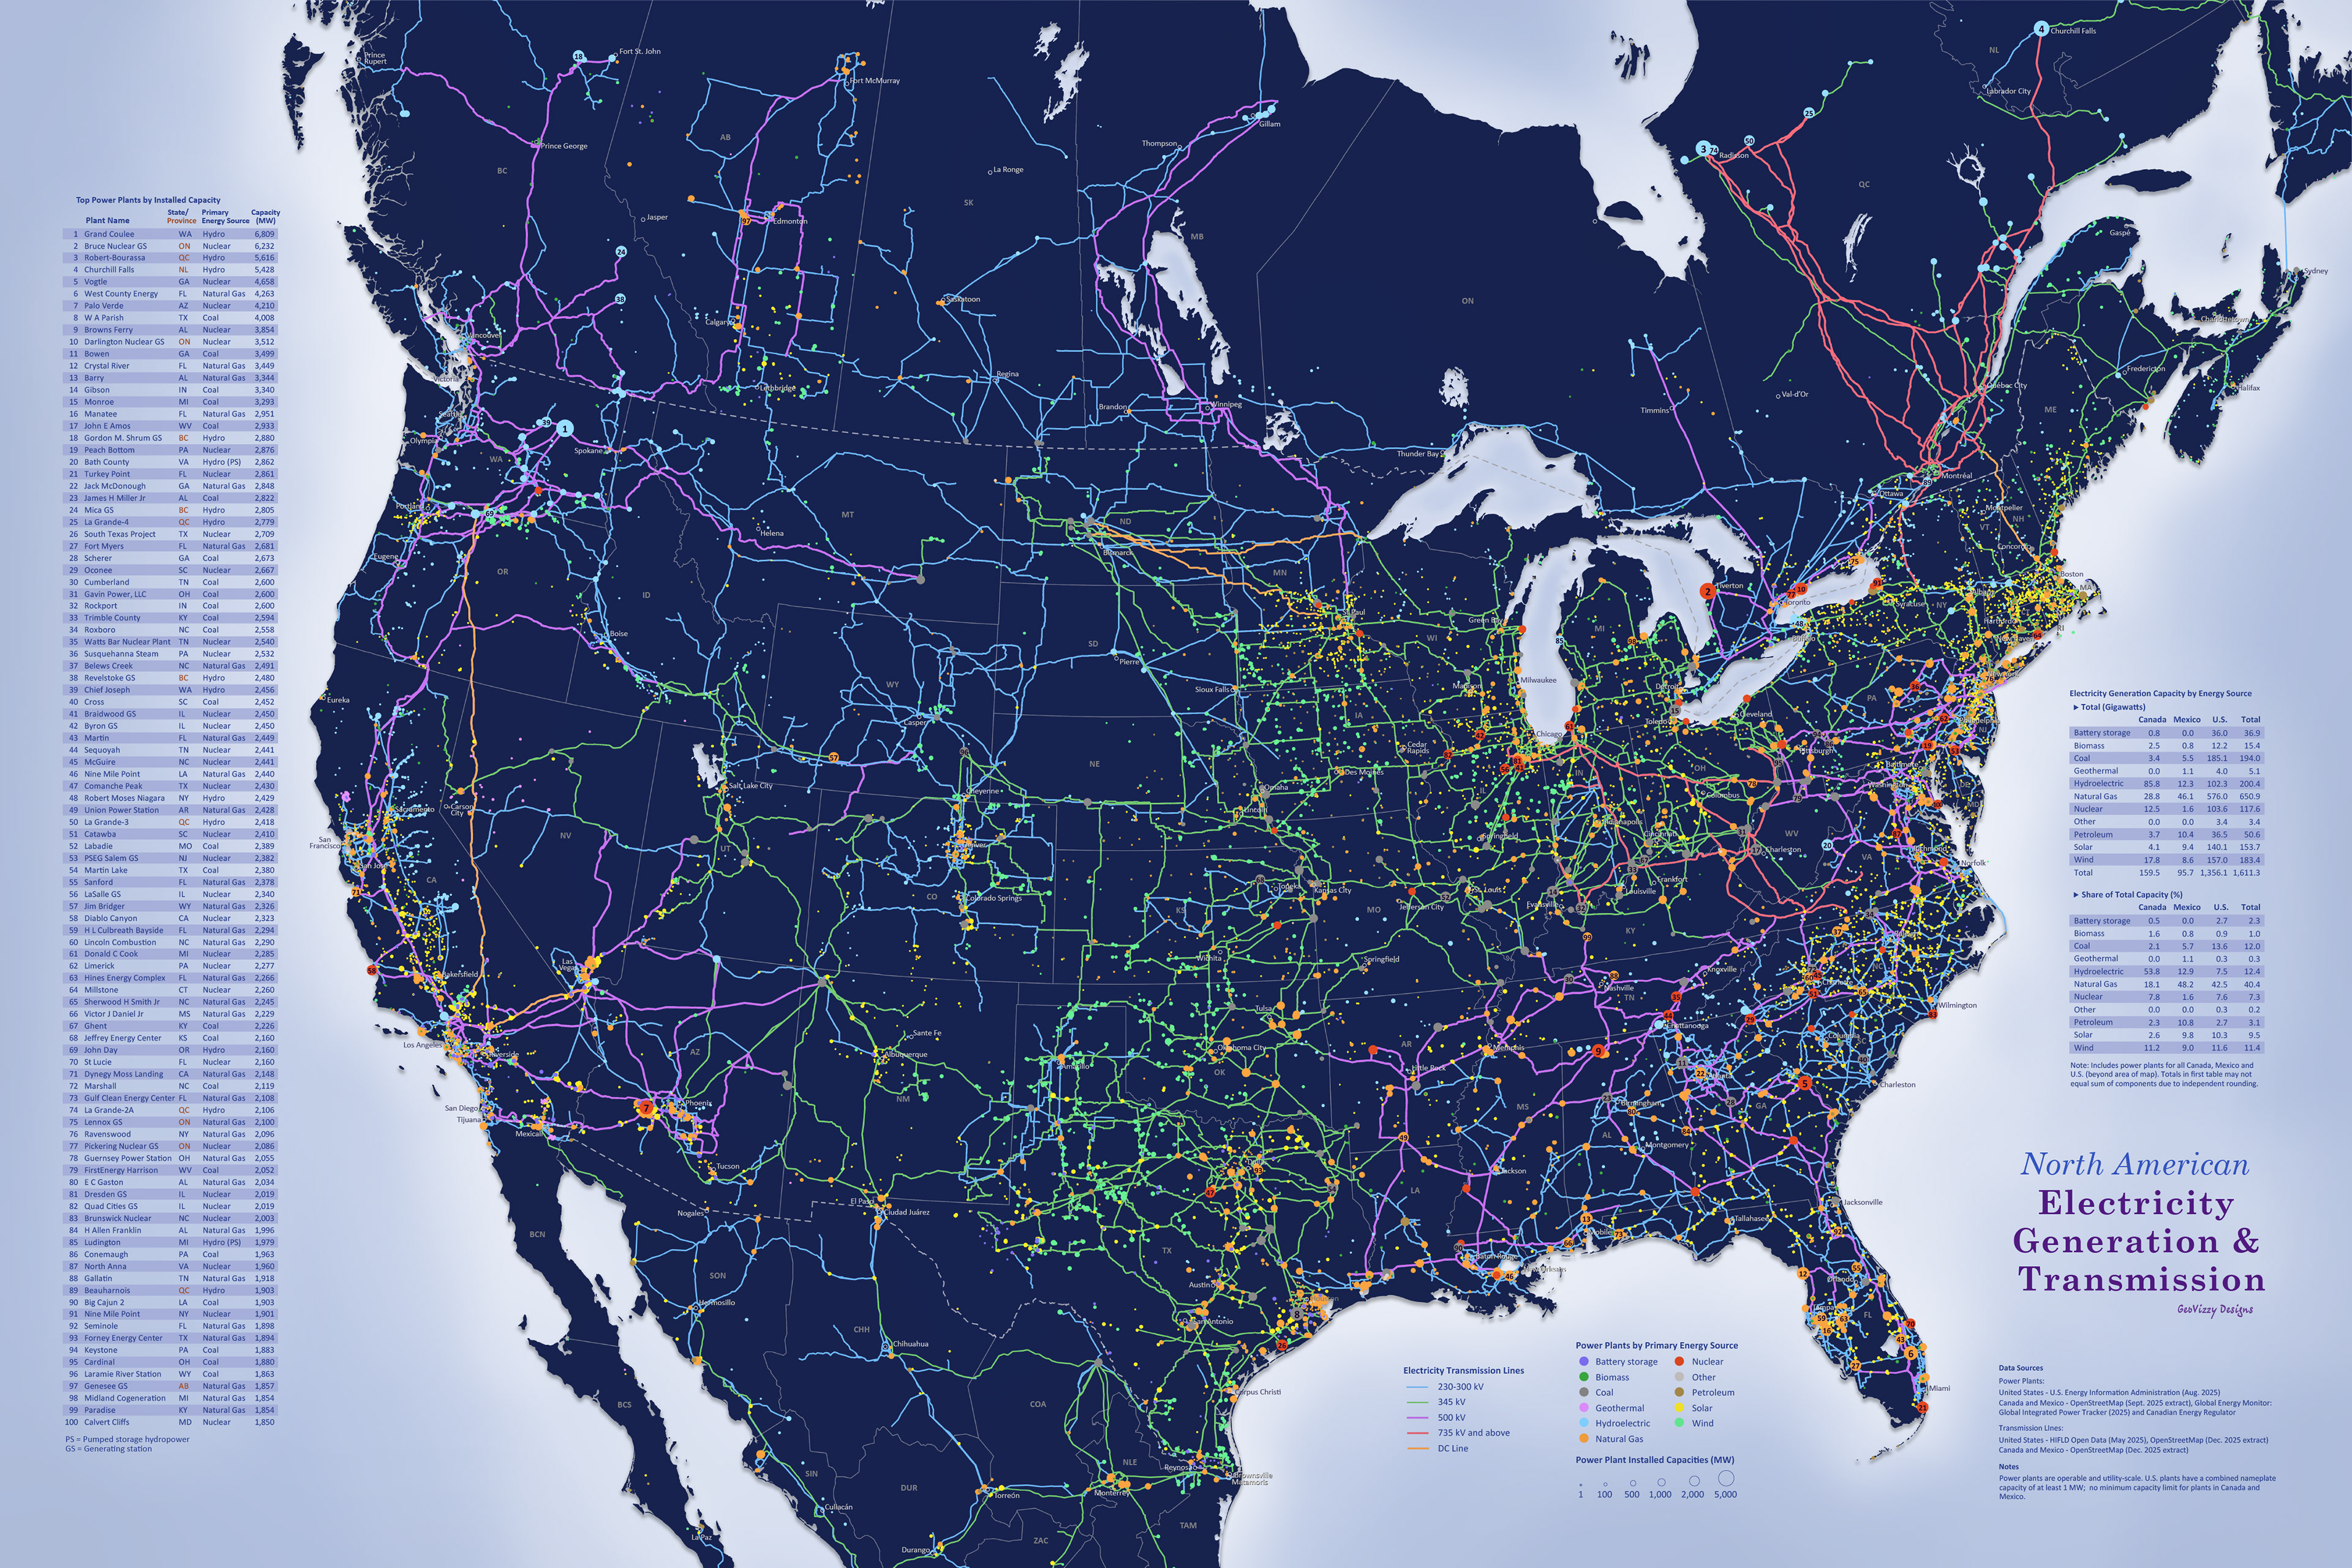
This map features high-voltage transmission lines and power plants categorized by 11 individual energy sources in the U.S., Canada, and Mexico. The top 100 power plants (by installed capacity) are identified by rank on the map and listed separately.
Technical notes
Power plants included are operable and utility-scale. If a plant uses more than one energy source, it was categorized by its predominant energy source. For the U.S., only plants with a combined nameplate capacity of at least 1 MW are included; there is no minimum capacity limit for plants included in Canada and Mexico.
The primary data source for U.S. transmission lines comes from HIFLD Open Data. Supplemental data from OpenStreetMap, validated using satellite imagery, was used to fill gaps in the HIFLD data.
Some map symbols were moved slightly to improve their visibility.
The tables showing aggregate country plant capacities are calculated somewhat differently depending on the country. For the U.S., total capacity is summed from individual fuel class classifications at the generator level. For Canada and Mexico, capacities are summed at the plant level by the primary energy source.
Data Sources
Power plants:
United States- U.S. Energy Information Administration, EIA-860M survey (Aug. 2025 data)
Canada and Mexico – OpenStreetMap (Sept. 2025 extract), Global Energy Monitor: Global Integrated Power Tracker (2025) and Canadian Energy Regulator.
Transmission lines:
United States - HIFLD Open Data (May 2025), OpenStreetMap (Dec. 2025 extract).
Canada and Mexico – OpenStreetMap (Dec. 2025 extract)
24"x36" high quality print available on Etsy